Zone B · Green approach
Localized dry-spot pattern
Lower GNDVI and NDVI values form an irregular patch within otherwise consistent turf.
- Modeled GNDVI
- 0.34
- Next check
- Soil moisture
UAS · MULTISPECTRAL · TURF MANAGEMENT
This simulated project compares three vegetation indexes for turf inspection, irrigation checks, and field follow-up.
01 / INTERACTIVE ANALYSIS
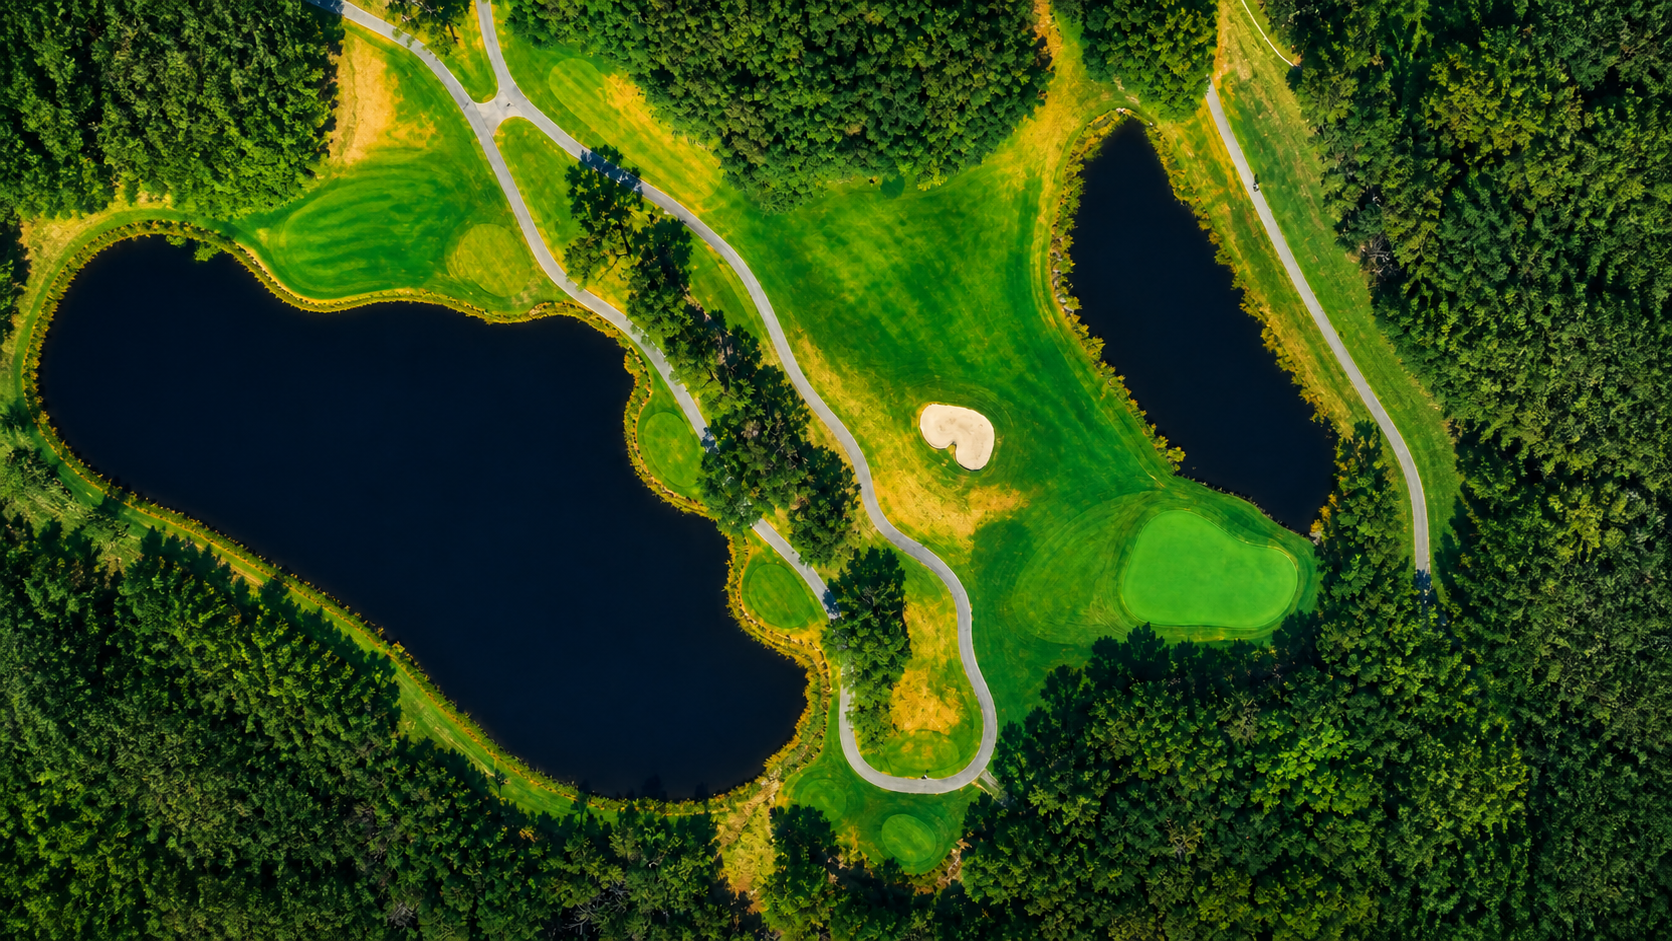
Choose NDVI, GNDVI, or OSAVI to see how each index changes the modeled view of Hole 5.
 Tee complexHole 5 green
Simulated vegetation-index view based on the supplied aerial reference.
02 / FIELD PRIORITIES
The mapped patterns suggest places to inspect; they do not diagnose a turf problem. Each zone would need to be checked in the field before treatment.
Zone B · Green approach
Lower GNDVI and NDVI values form an irregular patch within otherwise consistent turf.
Zone A · Tee-to-green corridor
A high-vigor linear signal may indicate uneven irrigation coverage or a leaking component.
Zone C · Bunker edge
OSAVI helps separate reduced turf cover from the brightness of adjacent sand and exposed soil.
03 / METHOD
The process begins with flight planning and calibration, then moves through image processing, index calculation, quality checks, and field verification.
Define safe flight blocks, consistent altitude and overlap, and radiometric calibration procedures.
Collect RGB, green, red, and near-infrared imagery under stable conditions.
Align bands, build the orthomosaic, calculate index rasters, and review positional and spectral quality.
Compare flagged zones with moisture, irrigation, disease, compaction, and turf-condition observations.
General greenness and canopy vigor
Chlorophyll and nitrogen sensitivity
Vegetation response with reduced soil influence
TEACHING APPLICATION
Students could compare NDVI, GNDVI, and OSAVI, explain the bands used in each calculation, identify possible turf-stress patterns, and design a field check before drawing conclusions.
Return to portfolio