Mean difference
The average Landsat 9 minus Landsat 7 value among the paired clear-land pixels.
PYTHON · GEOSPATIAL AUTOMATION · LANDSAT
The script retrieves, checks, aligns, compares, summarizes, and maps Landsat surface-temperature data.
01 / GENERATED OUTPUT
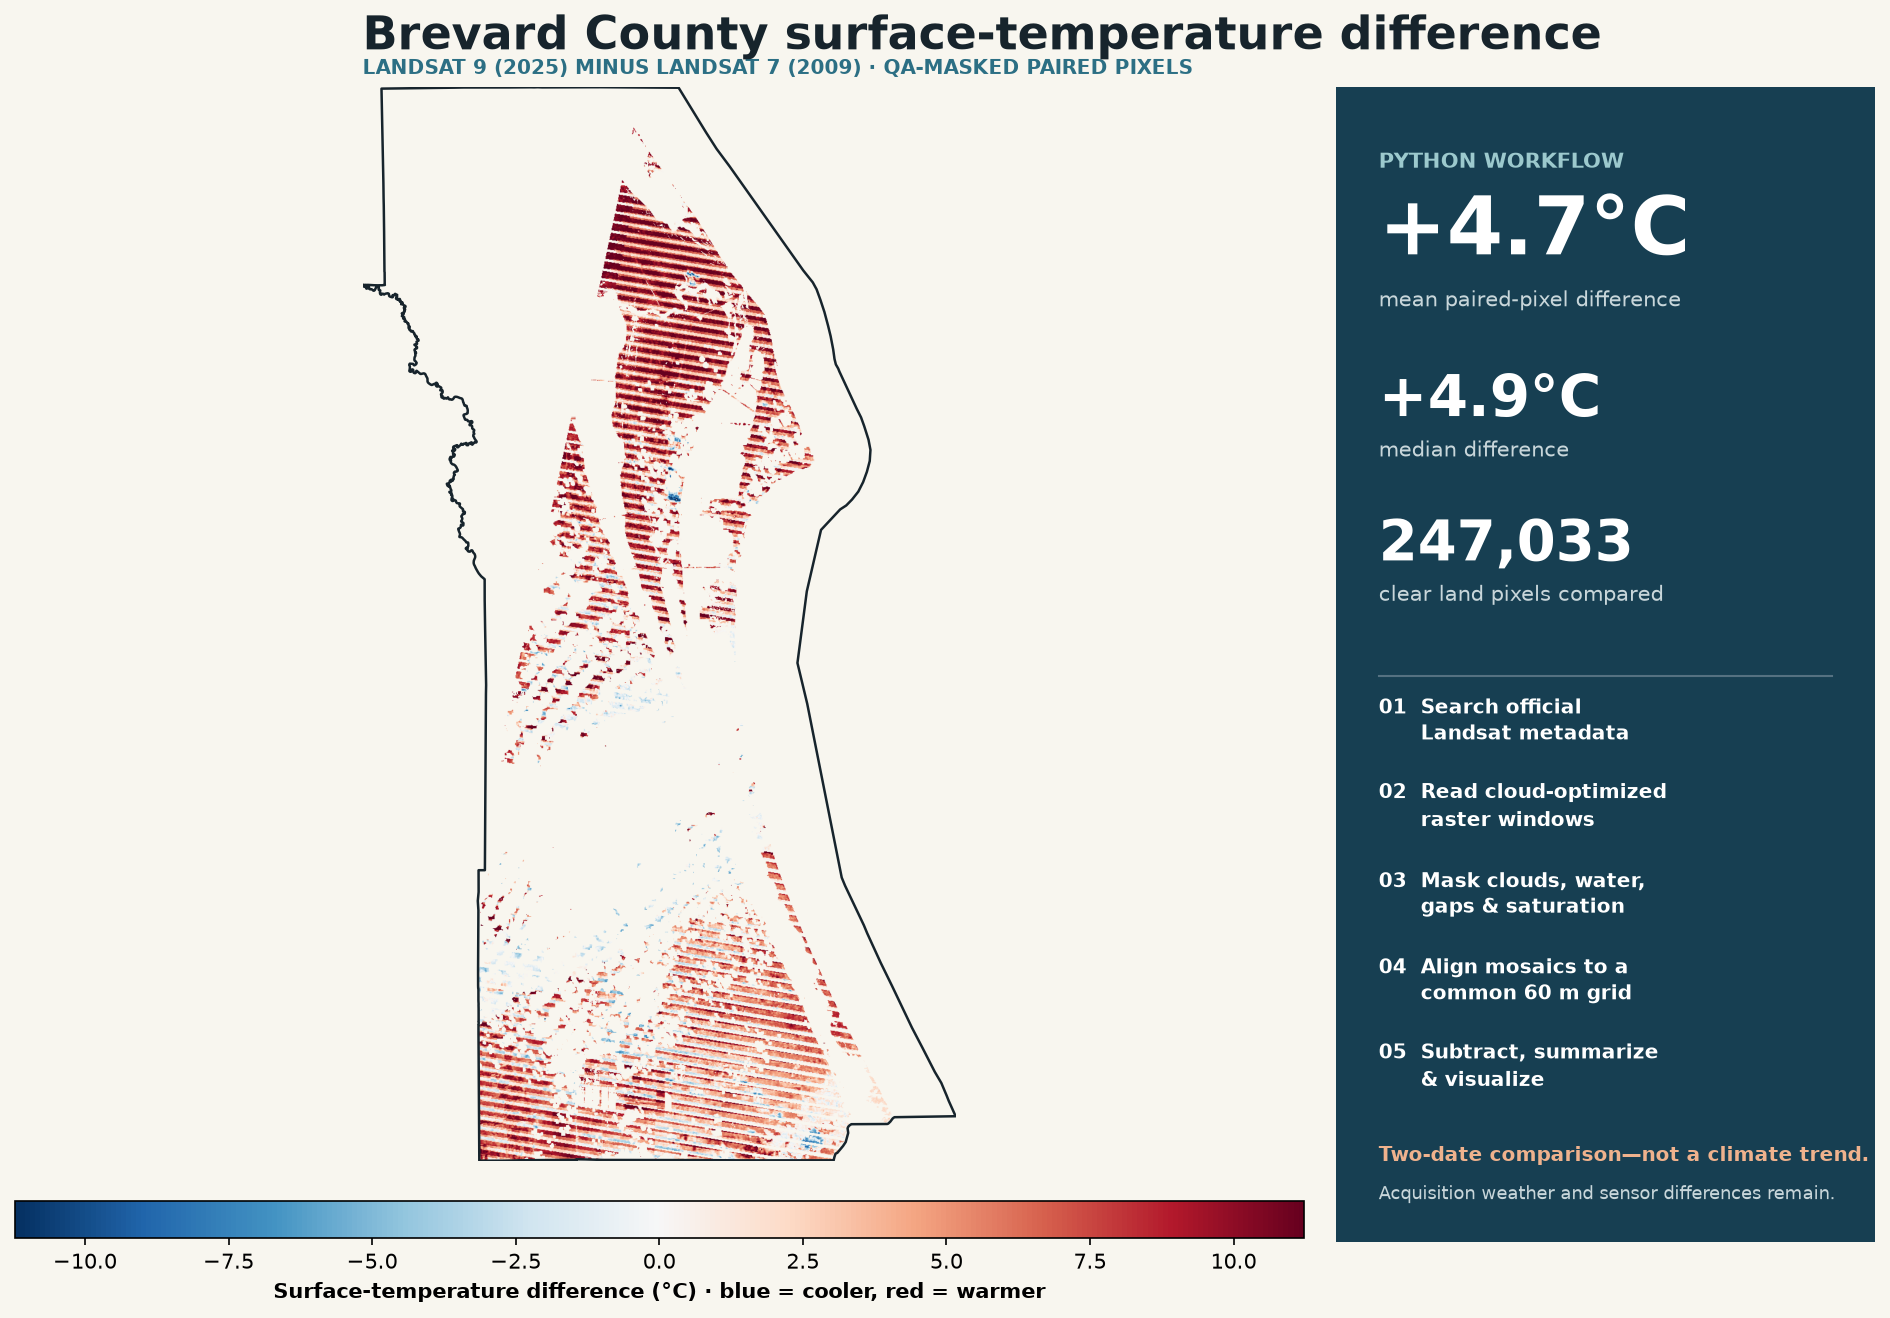
Only locations with valid, quality-screened temperature values in both periods are displayed and summarized.
02 / RUN SUMMARY
The values describe this specific pair of February datasets. They are not estimates of regional climate change.
The average Landsat 9 minus Landsat 7 value among the paired clear-land pixels.
The midpoint of the paired-pixel differences, less sensitive to extreme values than the mean.
The share of paired pixels more than 2°C warmer in the later observation.
Clear land cells remaining after the county clip, QA masks, alignment, and paired-data requirement.
03 / AUTOMATION
The five stages cover data discovery, raster processing, quality checks, calculation, and output.
Query the Landsat Collection 2 Level-2 STAC catalog for the specified February acquisitions and scene identifiers.
Stream the Brevard County windows from cloud-optimized GeoTIFFs instead of downloading every full Landsat band.
Decode QA bits to remove fill, clouds, cloud shadows, snow, water, saturation, and Landsat 7 dropped pixels.
Reproject the quality-screened mosaics to a common 60-meter grid and calculate Landsat 9 minus Landsat 7 in Celsius.
Generate the finished map and a machine-readable JSON summary from the same script used for the analysis.
QA masking
rejected_bits = sum(1 << bit
  for bit in (0, 1, 3, 4, 5, 7))
valid = ((qa_pixel & rejected_bits) == 0)
valid &= qa_radsat == 0
Temperature and difference
temperature_c = dn * 0.00341802
  + 149.0 - 273.15
difference = landsat_9 - landsat_7
04 / DATA INTEGRITY
Landsat 7 scan-line gaps remain visible. The workflow rejects dropped and fill pixels rather than interpolating them into apparently complete data.
Acquisition conditions matter. Weather, moisture, atmosphere, overpass timing, emissivity, and sensor differences can affect the result.
A longer record is needed. Multiple years, additional dates, and environmental controls would be required before making a long-term trend claim.
05 / TEACHING AND REPRODUCIBLE MATERIALS
The Python file and JSON summary could support a lesson on QA masking, reprojection, raster alignment, paired-pixel comparison, and reproducible reporting.
Source data: USGS Landsat Collection 2 Level-2, accessed through Microsoft Planetary Computer. Boundary: U.S. Census Bureau TIGERweb.