Surface, not air
The thermal signal represents land-surface temperature at the satellite overpass, not the temperature reported by a weather station.
LANDSAT · THERMAL REMOTE SENSING · BREVARD COUNTY
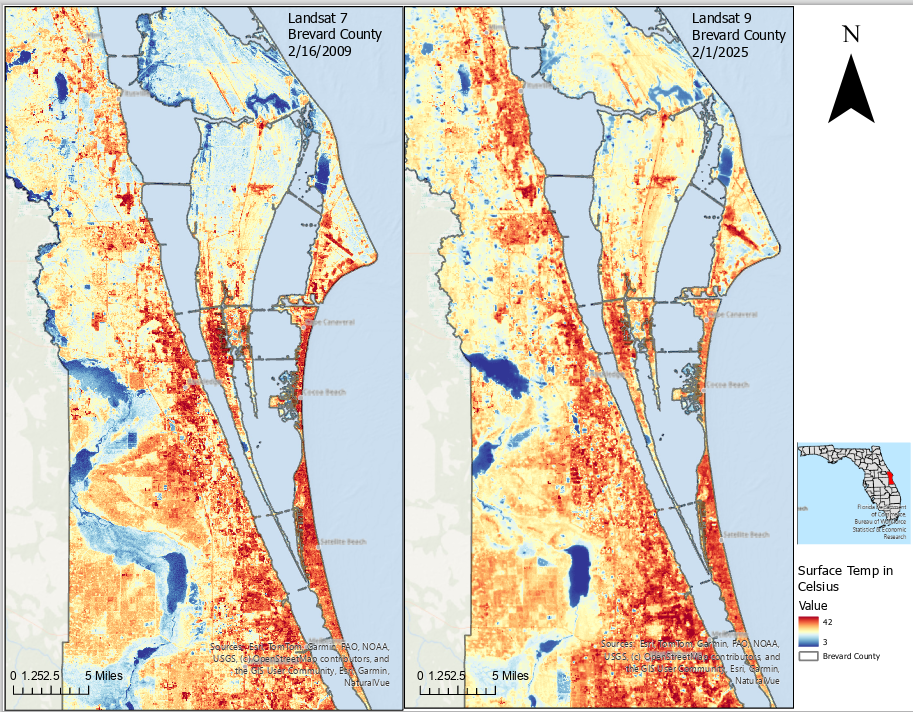
I placed Landsat 7 and Landsat 9 temperature maps on the same Celsius scale to compare two February observations.
01 / TEMPERATURE COMPARISON
The common Celsius color scale supports visual comparison of warmer and cooler surface patterns across the county.
02 / READING THE MAP
The paired scenes show spatial surface-temperature patterns, but they remain two observations rather than a long-term record.
The thermal signal represents land-surface temperature at the satellite overpass, not the temperature reported by a weather station.
Both scenes were acquired in February, reducing—but not eliminating—seasonal differences between the comparison dates.
Urban surfaces, vegetation, water, soil moisture, and coastal conditions can all influence the warm and cool patterns visible in each scene.
03 / ANALYSIS FRAMEWORK
I matched the seasonal timing and map extent, used a common color scale, and kept sensor and environmental differences in view while interpreting the result.
Use Landsat 7 imagery from February 16, 2009 and Landsat 9 imagery from February 11, 2025 to keep the acquisitions close in the seasonal calendar.
Clip both temperature rasters to the same Brevard County extent and display them with a common Celsius color scale.
Examine the distribution of warmer and cooler surfaces in relation to development, vegetation, inland water, and coastal geography.
Consider clouds, cloud shadows, surface moisture, atmospheric conditions, sensor differences, emissivity, and Landsat 7 scan-line gaps before attributing differences to landscape change.
04 / TEACHING APPLICATION
Students could use these scenes to discuss land-surface temperature, seasonal matching, sensor differences, cloud and scan-line masking, and why two dates do not establish a climate trend.
Return to selected work