Elevation model
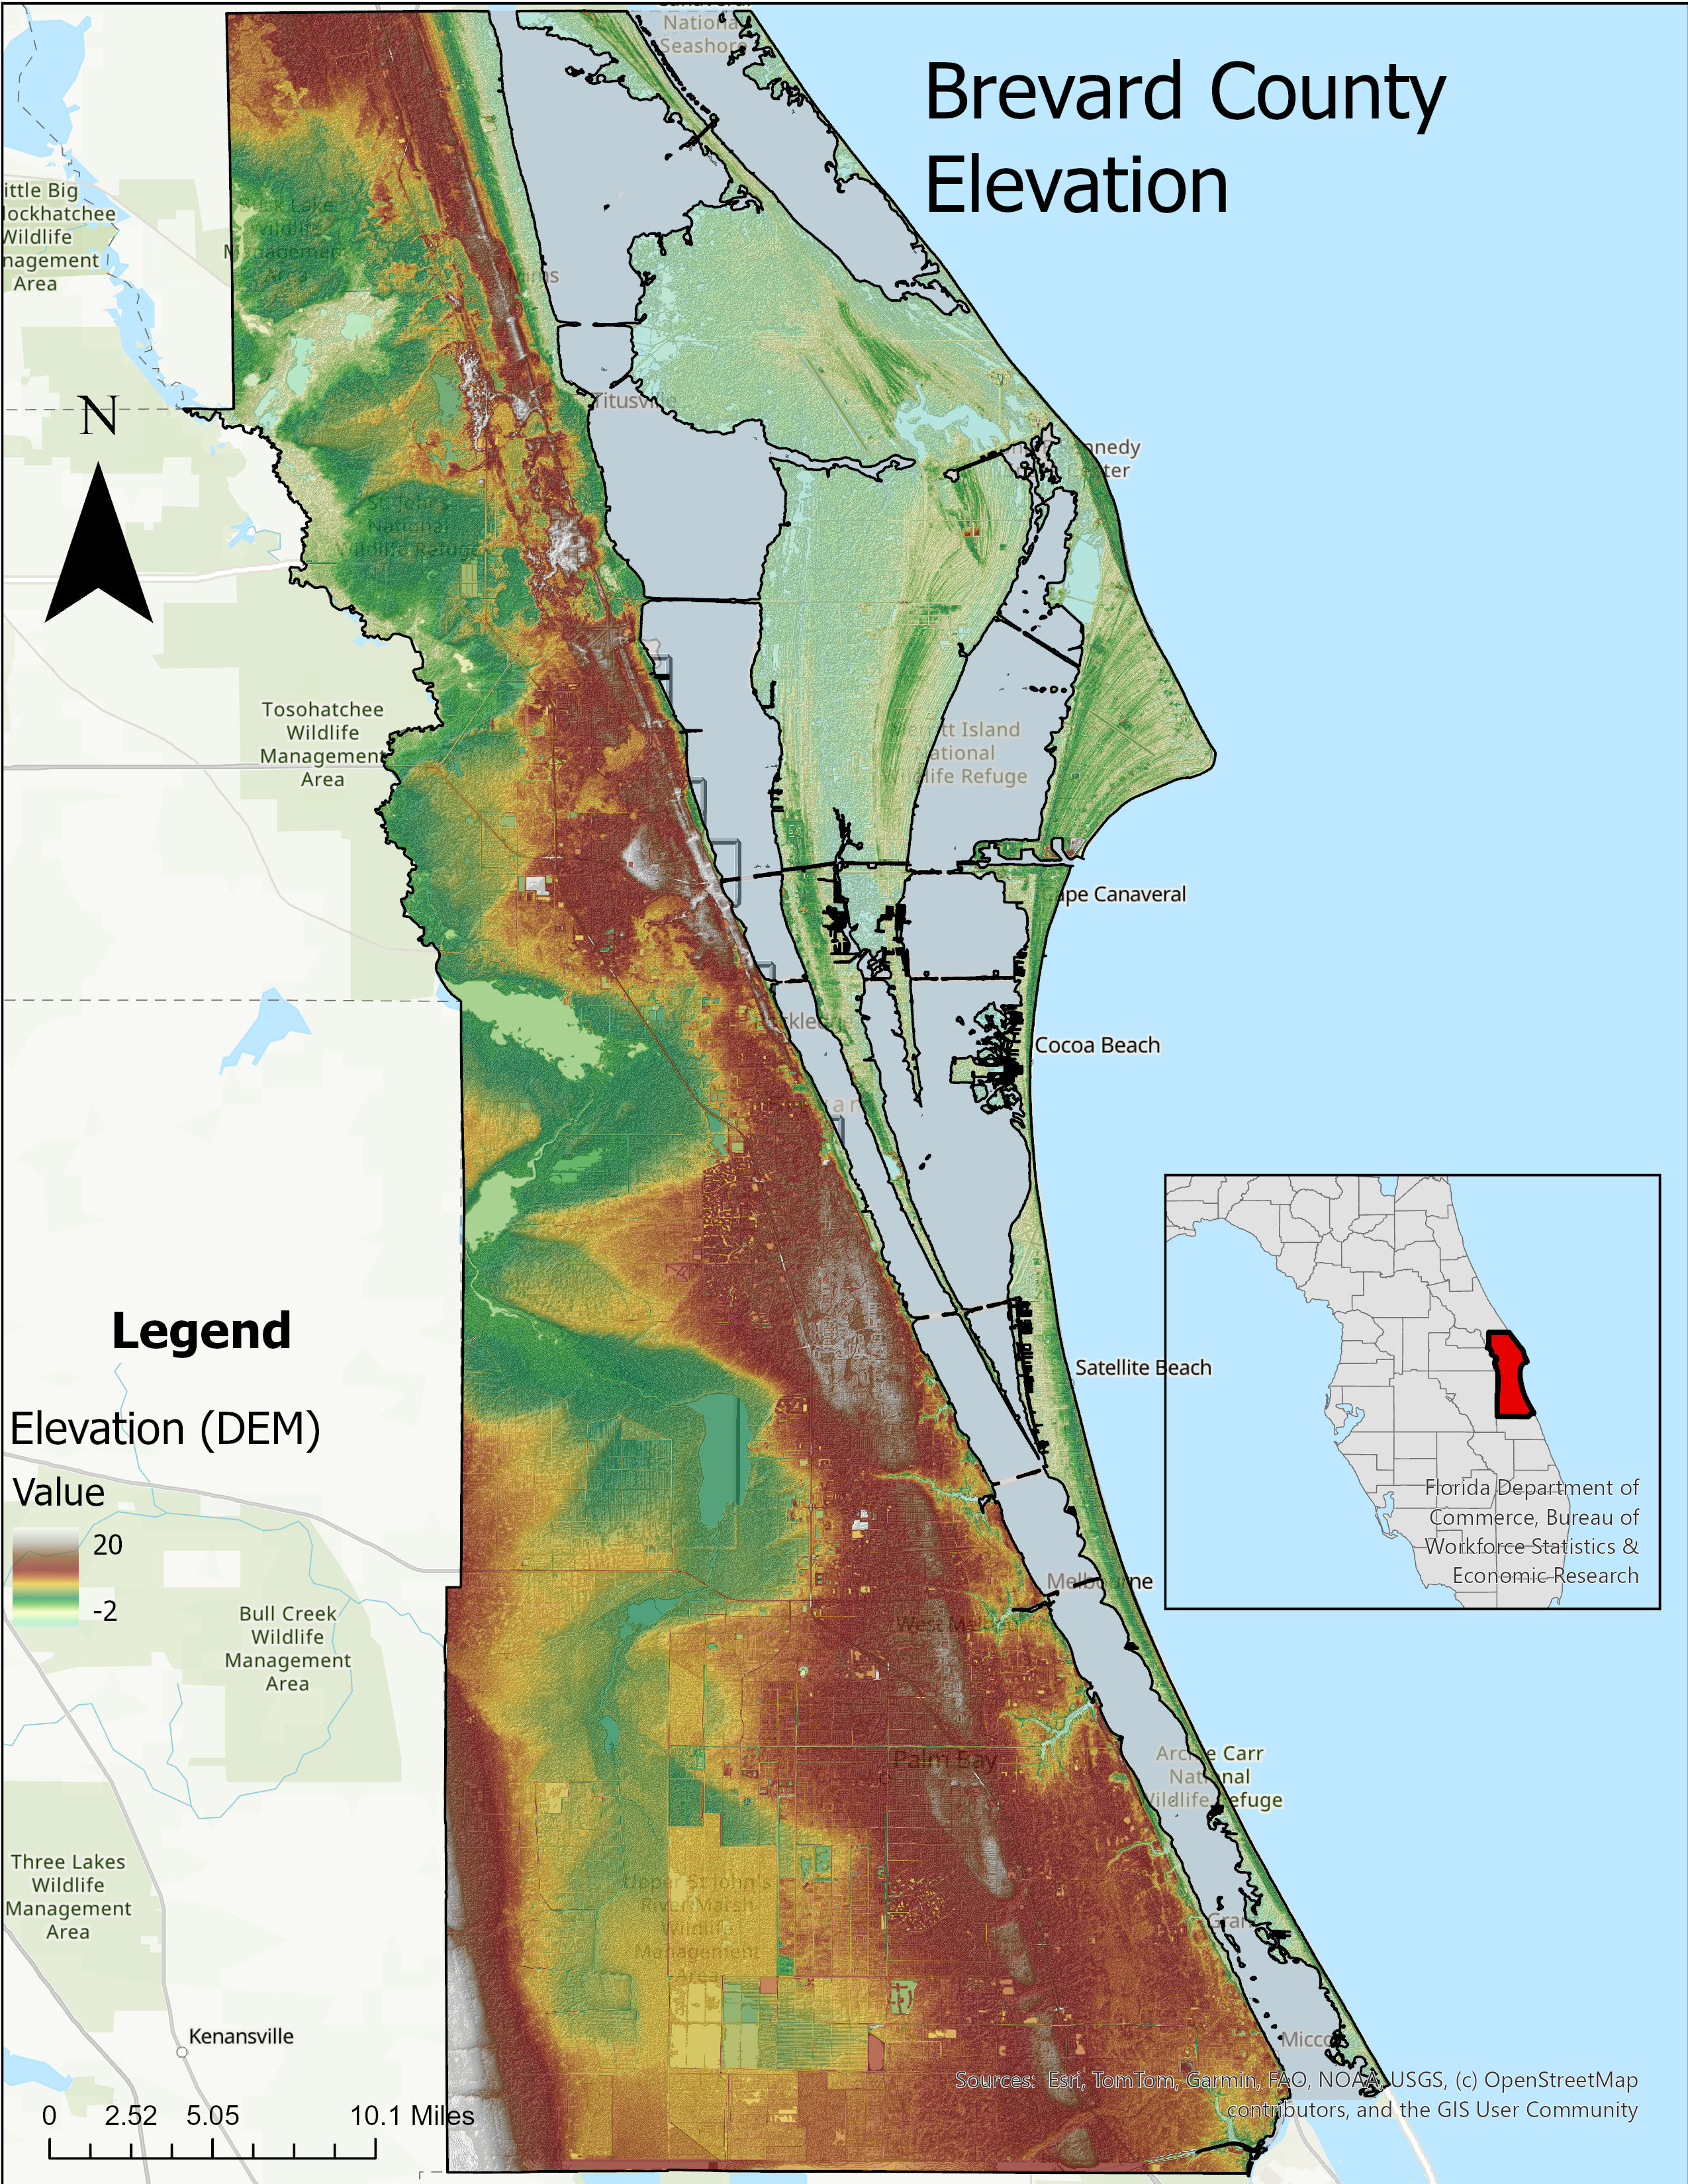
Prepare and symbolize a digital elevation model to reveal Brevard County's subtle relief while retaining roads, waterways, boundaries, and recognizable place context.
ENVIRONMENTAL GIS · RASTER DATA · CARTOGRAPHY
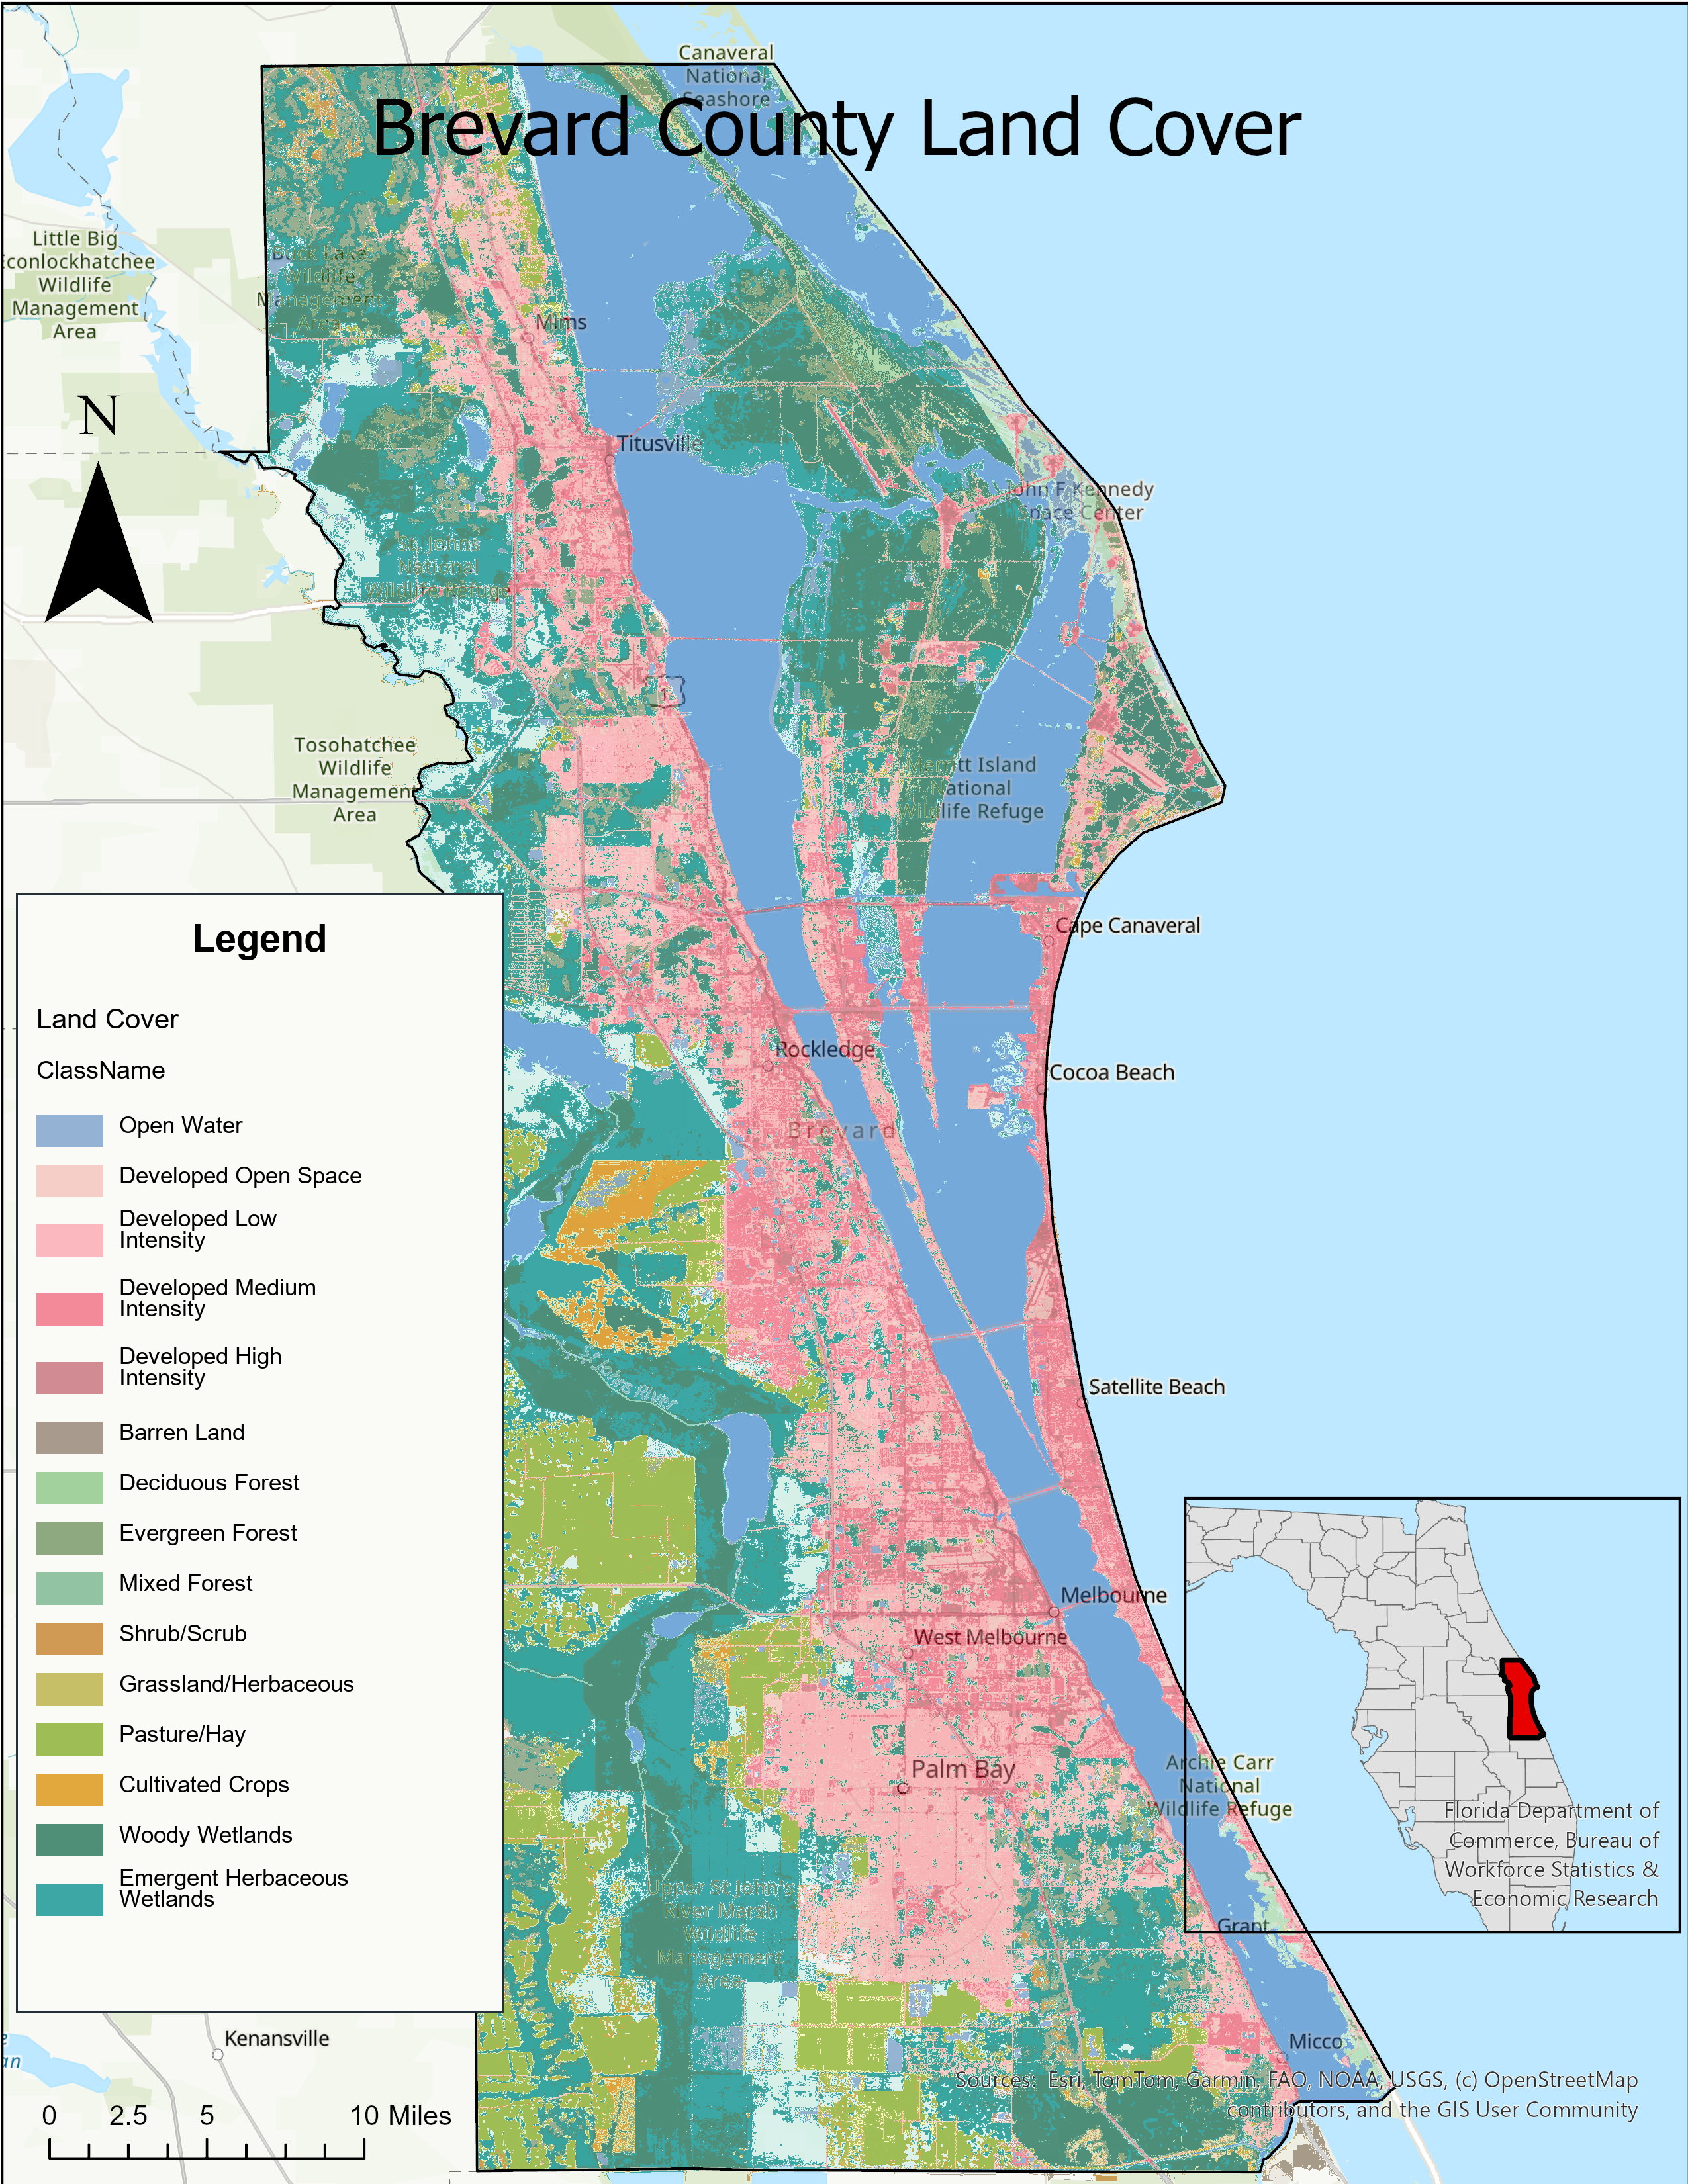
Paired cartographic products showing the county's physical relief and Landsat-derived land-cover classes within a consistent geographic context.
01 / CARTOGRAPHIC PRODUCTS
The full-size maps make the legends, reference geography, scale, and Florida locator easier to read than they are on the portfolio homepage.
02 / METHODS AND DATA
I used the same county boundary, supporting geography, scale information, orientation, and Florida locator on both maps so readers can compare them easily.
Prepare and symbolize a digital elevation model to reveal Brevard County's subtle relief while retaining roads, waterways, boundaries, and recognizable place context.
Apply class-based symbology to Landsat-derived land-cover data so developed areas, forests, wetlands, agriculture, water, and other classes remain distinguishable.
Combine each analytical raster with a clear legend, scale bar, north arrow, source information, county outline, and statewide locator map.
03 / INTERPRETATION
The elevation map communicates patterns contained in the source DEM; its apparent precision depends on the resolution and accuracy of that dataset.
I interpreted and mapped an existing Landsat-derived classification product. I did not independently produce its classes from raw Landsat scenes.
04 / TEACHING APPLICATION
I would ask students to compare what each raster represents, examine how resolution and classification affect interpretation, and critique the legends, colors, scale, and locator map.
Return to selected work